Global COVID-19 Data and Policy Tracking Framework Transitioned as International Reporting Shifts to Endemic Phase

The landscape of global health data tracking has undergone a monumental shift as public health institutions adapt to the transition of COVID-19 from a global pandemic emergency to a managed endemic disease. For years, trackers operated by academic institutions, non-profit organizations, and international health bodies served as vital lifelines for policymakers, researchers, and the general public, synthesizing millions of data points on infection rates, mortality, and governmental interventions. However, with the phasing out of dedicated data collection streams by primary sources such as the Johns Hopkins University (JHU) Coronavirus Resource Center and the Oxford Covid-19 Government Response Tracker (OxCGRT), public health dashboards have reached a historic turning point. Organizations that previously monitored every facet of government policy—ranging from strict workplace closures and international travel restrictions to broad economic stimulus and vaccine rollouts—have finalized their archives, leaving a legacy of unprecedented data collection that will inform epidemiological study for decades to come.
Background Context and the Evolution of Global Tracking
When the SARS-CoV-2 virus emerged in late 2019 and rapidly escalated into a global health crisis, the international community faced an acute information deficit. Governments struggled to implement effective non-pharmaceutical interventions (NPIs) without standardized metrics, and researchers lacked unified databases to analyze the efficacy of lockdowns, mask mandates, and economic relief packages. In response, academic institutions and research groups stepped into the void. The Oxford Covid-19 Government Response Tracker, initiated early in the pandemic, became the gold standard for systematically documenting government policies across more than 180 countries. Simultaneously, institutions like Johns Hopkins University launched interactive mapping tools that aggregated daily case and death counts reported by national ministries of health, establishing a transparent public record that held governments accountable and guided evidence-based decision-making.
As the acute phase of the pandemic waned and global vaccination campaigns altered the severity and transmission dynamics of the virus, the necessity for daily emergency tracking diminished. National governments increasingly scaled back their reporting frequencies, shifting from daily updates to weekly or monthly summaries, or integrating COVID-19 surveillance into existing respiratory virus monitoring frameworks like influenza and RSV surveillance. Consequently, the foundational data sources that powered comprehensive trackers began to wind down their operations. JHU officially concluded its landmark coronavirus mapping project on March 10, 2023, prompting aggregators like the Kaiser Family Foundation (KFF) to transition their data pipelines to the World Health Organization’s (WHO) Coronavirus Dashboard as of March 7, 2023. Furthermore, because the primary data source for governmental policy actions ceased tracking official pandemic responses, policy trackers have frozen their datasets at end-of-2022 benchmarks, marking the official close of a unique era in public administration research.
Chronology of Key Tracking Milestones
The lifecycle of pandemic data tracking reflects the shifting phases of the global crisis itself, marked by several critical operational transitions:
Early 2020: The rapid spread of COVID-19 triggers the immediate establishment of ad-hoc tracking systems. Academic databases, including the Oxford Covid-19 Government Response Tracker and the Johns Hopkins University Coronavirus Resource Center, begin daily aggregation of global infections, fatalities, and containment policies.
2020–2022: Trackers become indispensable tools for global governance. Governments utilize policy indices to calibrate social distancing measures, school closures, international travel controls, and economic support mechanisms such as income replacement and debt relief.
March 7, 2023: In response to evolving reporting structures, major public health data aggregators transition their primary source for confirmed COVID-19 cases and mortality rates from Johns Hopkins University to the World Health Organization’s (WHO) Coronavirus Dashboard.
March 10, 2023: The Johns Hopkins University Coronavirus Resource Center officially ends its map and data archive after three years of continuous public service.
End of 2022 / Ongoing: Policy action datasets are permanently frozen at late-2022 levels. Data sources discontinue the active monitoring of government responses as nations lift emergency declarations, dismantle pandemic task forces, and transition entirely to endemic disease management frameworks.
March 18, 2024: Public health aggregators implement retroactive data corrections to clarify that historical reporting metrics represent cumulative new cases and deaths over a full seven-day period rather than daily rolling averages, ensuring absolute precision in long-term epidemiological archives.
Methodological Framework and Data Architecture
Maintaining historical continuity across years of pandemic reporting required complex methodological adjustments. Comprehensive trackers traditionally categorized incoming data into distinct pillars: epidemiological metrics (confirmed cases and deaths) and policy action metrics (social distancing, economic support, and health systems measures).
For epidemiological data, population denominators were routinely drawn from the United Nations World Population Prospects using 2021 total population estimates, allowing analysts to calculate standardized per-capita infection and mortality rates across diverse geographies. Country income-level classifications were standardized using World Bank Country and Lending Groups, while regional categorizations aligned with official World Health Organization boundaries. To optimize performance and prevent excessive load times on digital platforms, public-facing dashboards frequently restricted active on-screen visualization to the preceding 200 days, while preserving the complete historical repository via open-source code repositories such as GitHub.
The policy action framework was similarly rigorous, evaluating government interventions across highly specific sub-categories:
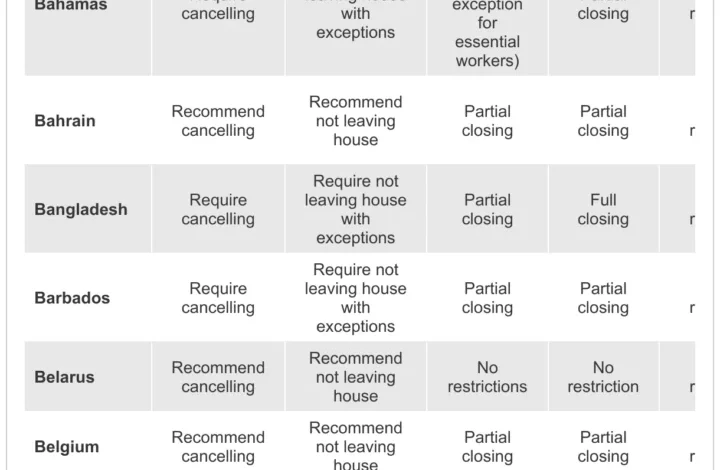
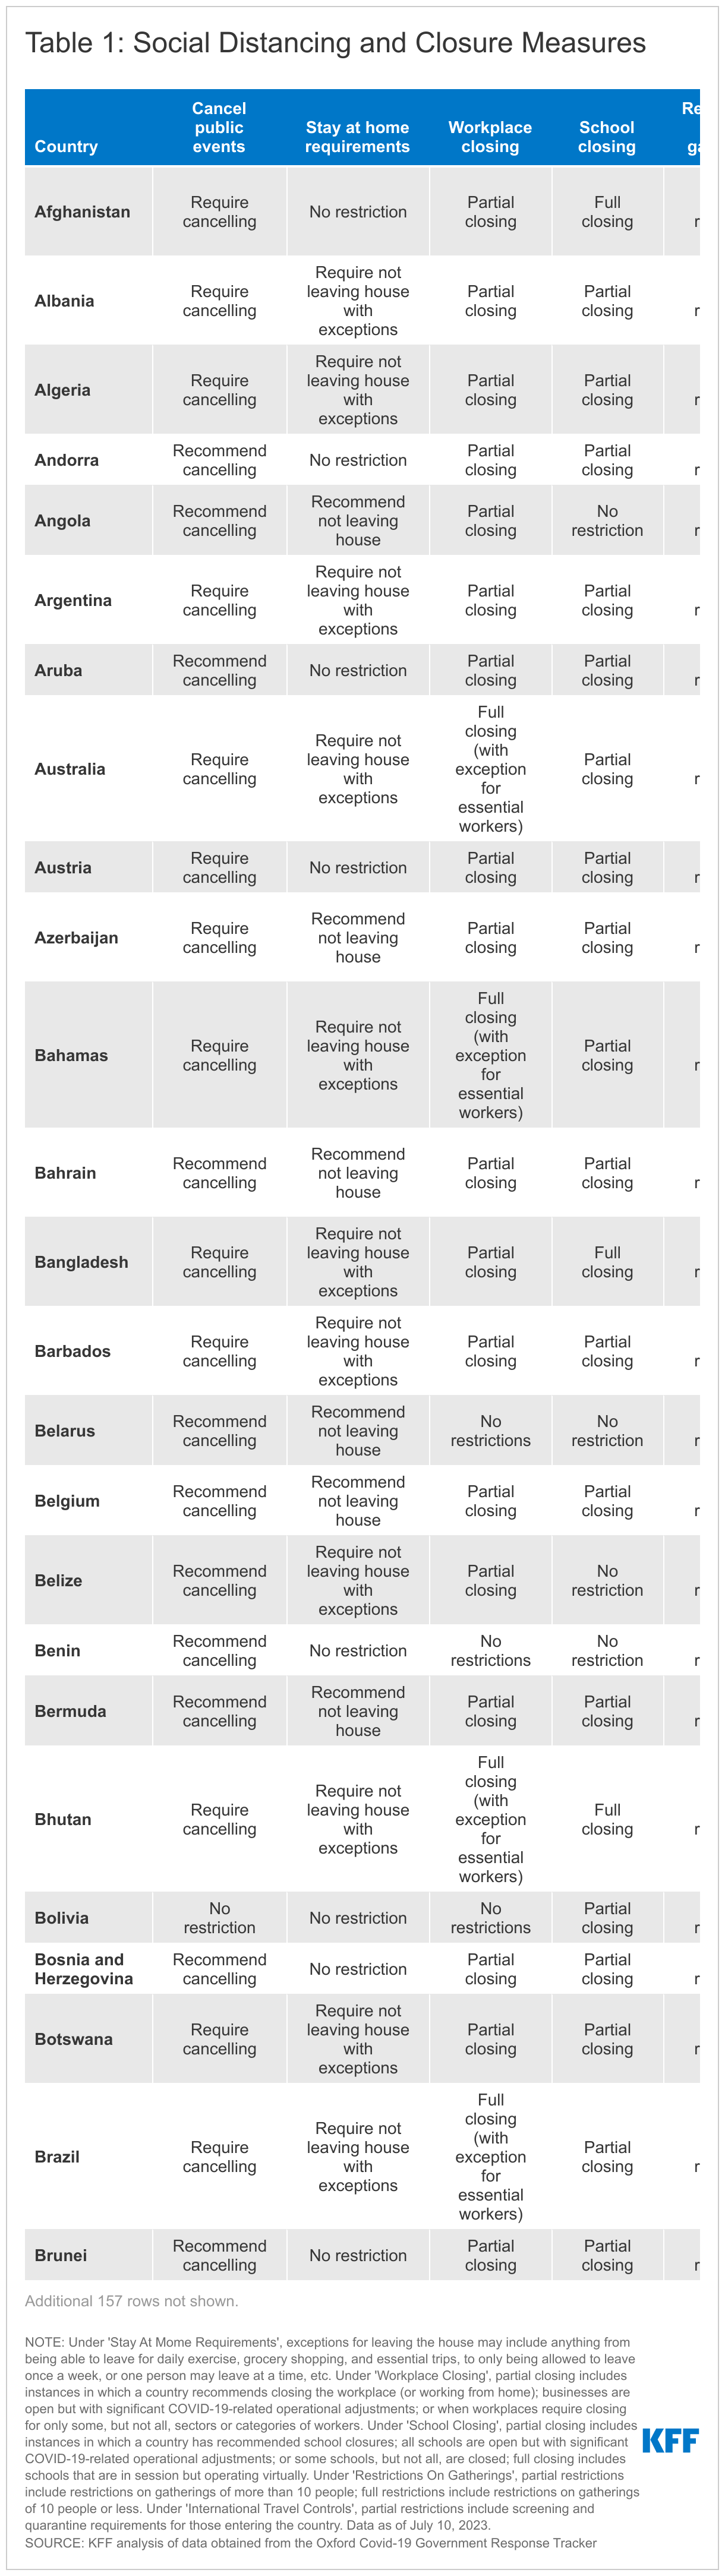
Social Distancing and Closure Measures: This domain tracked mandates including workplace closures (ranging from full closures to advisory work-from-home policies and sector-specific restrictions), school closures (covering physical shutdowns, hybrid models, and mandatory virtual learning), restrictions on public gatherings (categorized by group size thresholds), international travel controls (including mandatory screening and quarantine protocols), and stay-at-home requirements with varying degrees of exemption for exercise, essential shopping, and household errands.
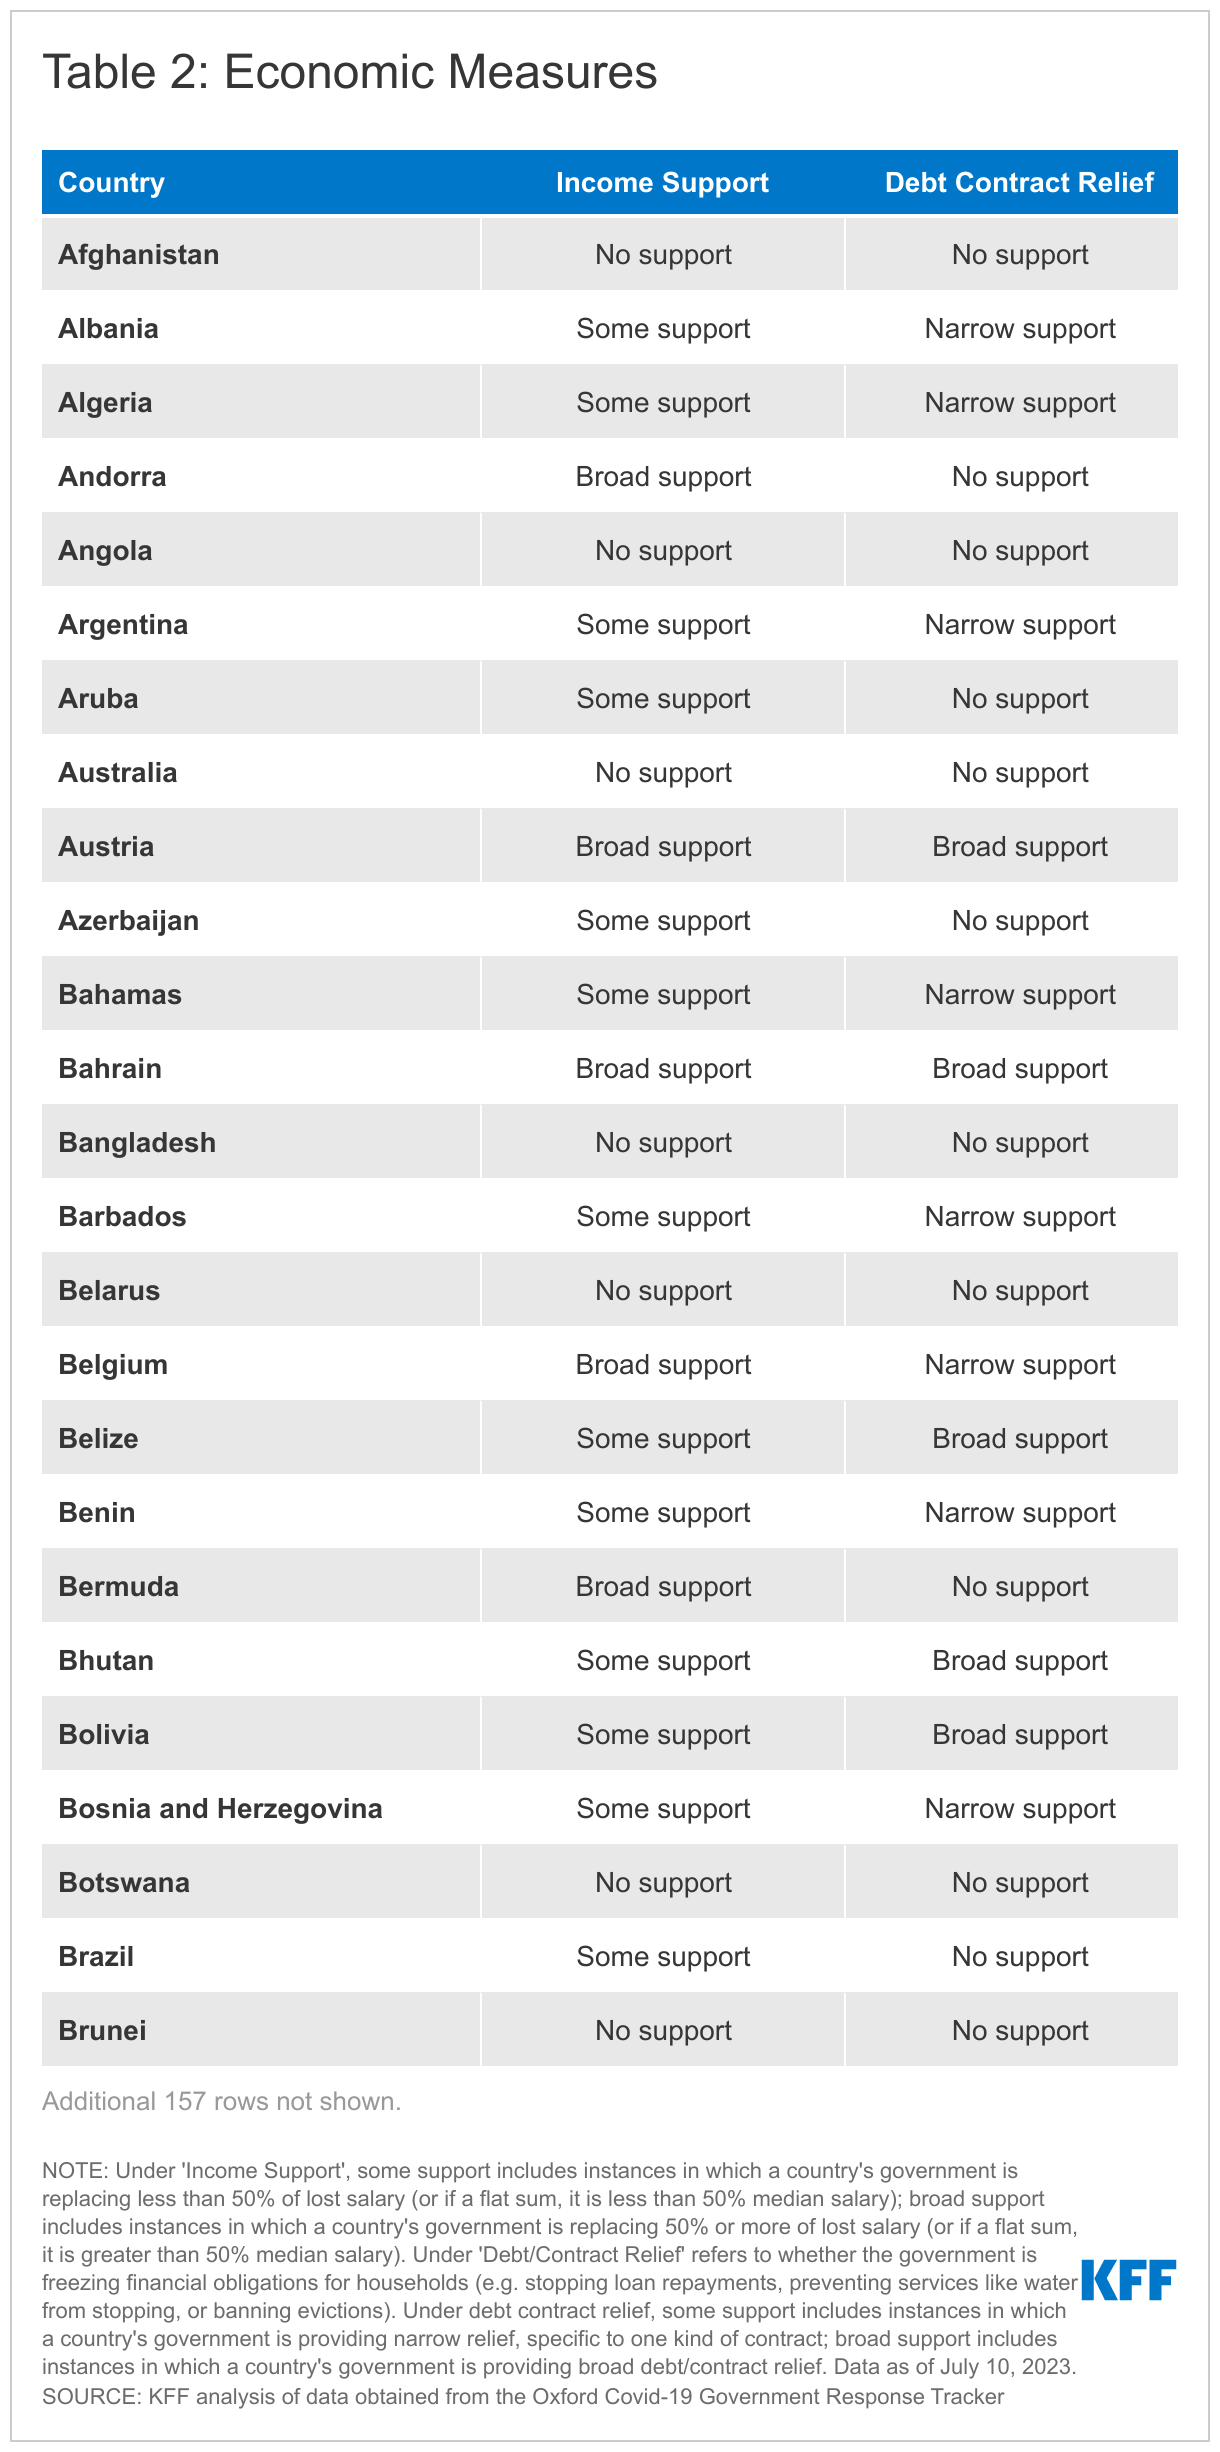
Economic Measures: Governments deployed unprecedented fiscal interventions, which trackers categorized into income support—distinguishing between narrow support (replacing less than 50 percent of lost salary) and broad support (replacing 50 percent or more)—as well as debt and contract relief measures designed to protect vulnerable households and businesses from financial collapse.
Health Systems Measures: This pillar monitored the rollout of critical medical infrastructure, including vaccine eligibility expansions (tracking availability for key workers, clinically vulnerable populations, and elderly demographics) and facial covering mandates, which ranged from generalized public recommendations to strict legal requirements in indoor or un-socially distanced environments.
Implications for Future Public Health Preparedness
The freezing of policy trackers and the restructuring of epidemiological dashboards carry profound implications for public health scholarship, economic research, and future pandemic preparedness. During the height of the crisis, the availability of granular, cross-national data allowed epidemiologists to model the transmission dynamics of SARS-CoV-2 with unprecedented speed. Economists leveraged policy indices to study the trade-offs between stringent lockdown measures and economic contraction, providing empirical foundations for debate over optimal crisis governance.
By preserving these datasets in static archives and open-source repositories, the global scientific community ensures that future generations of researchers can conduct retrospective analyses of public health interventions. Scholars can examine why certain regions successfully suppressed transmission with targeted closures while others experienced catastrophic healthcare strains despite aggressive policy interventions. Furthermore, the lessons learned from the fragmentation and subsequent consolidation of global health data—moving from disparate university dashboards to centralized WHO frameworks—will directly inform the architecture of future global health security systems. As international health organizations negotiate new pandemic treaties and strengthen surveillance networks, the digital footprint left by COVID-19 tracking initiatives will serve as both a historical record and a structural blueprint for managing future biological threats.